python for data & analytics a business-oriented approach

Today, Python has become one of the key tools for any business to extract meaningful value out of their data in our transforming world into a Data-driven society. Python is not just a programming language, instead its flexibility and availability of wide range libraries makes it as complete solution for data analysis and business intelligence. In this article – a business perspective to why, what and how to go for Python in data & analytics…
1. Python and Data Driven Business Strategies
Python has rightfully earned its popular place in the data science and analytics community. It is user-friendly and easy to comprehend, meaning even a non-techie layman can also work without problems. There are multiple benefits to businesses of Python :
- Learning & Usability: The clear readability of Python enables users to learn and apply sophisticated data analysis techniques with ease.
- Rich Libraries: Pandas, NumPy and SciPy are great libraries for manipulating data structures & doing statistical analysis/analysis on numbers.
- Community Support: A large community allows businesses timely upgrades, support and a sea of resources to keep pace with the latest advancement in data science.
2. These Are The Main Python Libraries For Data Analysis And Business Intelligence
There are vast libraries in Python to work with Data Analysis and Business Intelligence such as — At the start of this journey, it was difficult for me to pinpoint specific changes but in hindsight, some seemed like nature’s course.
- Pandas: The core Python library for data manipulation and analysis, which can be used to help businesses manage their data (based on Data Frames) much more efficiently.
- NumPy: Essential for numerical operations and handling large data sets It allows working with multi-dimensional arrays and matrices, which makes crunching large numbers easier.
- Matplotlib and Seaborn: Libraries to make informative yet aesthetically pleasing charts and graphs for data visualization
- Scikit-learn – an extremely easy-to-use library for machine learning and predictive analytics (classification, regression, clustering etc.)
3. Python for Business Analytics
Here are the steps to integrate python into business analytics: Part 2: A more concise method
- Data to collect: How you can use Python for data collection that includes Databases, Web Scraping and API?
- Data cleaning: Using Pandas to clean and preprocess our data, handling missing values and inconsistencies in the way that different files are formatted.
- Analytics with Python: Use the analytical python packages to extract meaningful information from data, detect trends or patterns and find anomalies too.
- Data Visualization: You will use Matplotlib and Seaborn to create charts that not only show the data but make it easier for decision makers.
- Reporting and Communication – Develop data packages and dashboards using Jupyter Notebooks for Actionable Insights to be shared with stake holders.
4. Discussion Case studies: Python in action for business success
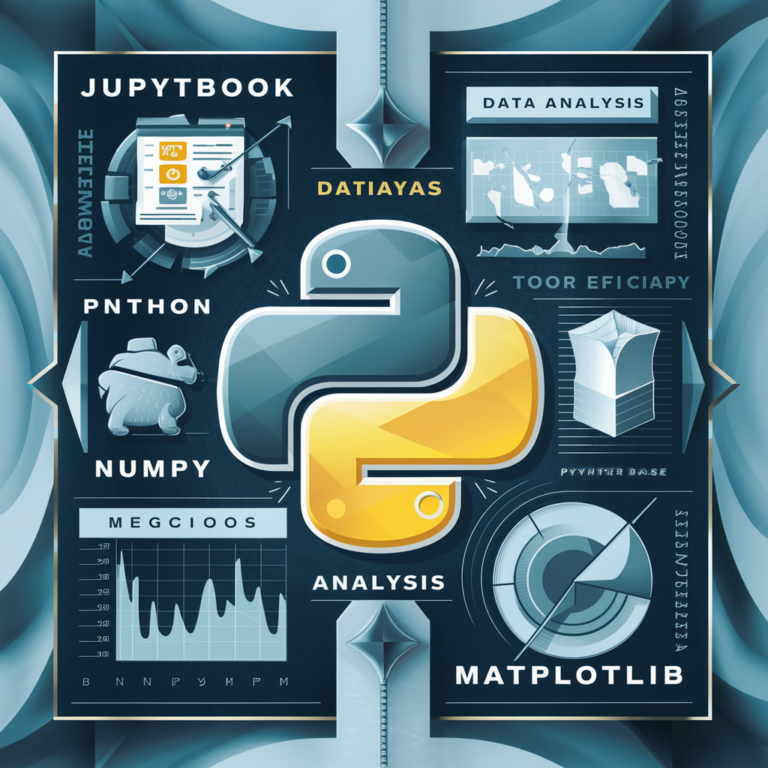
Python has already been utilised by many companies for data analytics and their output are astonishing over :PYhton Data Analysis
- Retail Industry: A large retailer applied Python to analyze history of customers purchases, in assisting marketing strategies and boosting sales.
- Finance: A financial company used Python to analyze risk and detect fraud, thereby strengthening its defense against monetary threats
- Healthcare – Hospitals and research institutions used Python to analyze patient data, identify optimal treatment plans which led in improving the life expectancy of patients through better outcomes and even increased operational efficiency.
5. Python for Business Analytics : Best Tips & Practices
A rule-of-a-thumb guide to the best practices is a general strategy (in this case, Python) that will get you up and running quickly using data, analytics or stats concepts!
- Invest in Training: Make sure your team is upskilled and has the capabilities to leverage Python for data analysis efficiently.
- Keep Data Secure: Take steps to secure the sensitive data throughout your analytics process.
- Keep Tools Up-to-date: Always keep the libraries and tools of Python updated to take benefit from recent features, and enhancements.
- Collaborate: Ensure collaboration of data scientists with business stakeholders to align analytics agenda with business objectives.
- Monitor Performance- Regularly monitor the performance of your data analytics operations and tweak components as required for maximum outcome.
Conclusion
And Python: a potent tool for businesses acquisitive to become data driven. Businesses can gain valuable insights, influence strategic decision-making and stay ahead in an ever-growing competition by understanding it – what works or not. Whether you are just starting out in Python or a seasoned data practitioner, adoption of the most dynamic programming language today has become forceful advantage normally when working with web analytics.
Mostly Ask Queries
Sure, here’s a list of common queries related to “Python for Data & Analytics: A Business-Oriented Approach”:
- Python for Business Analytics
- Python Data Analysis Tools
- Benefits of Python in Data Science
- Python Libraries for Data Visualization
- Case Studies Python Data Analytics
- Python for Predictive Analytics
- Implementing Python in Business Intelligence
- Best Practices for Python Data Analysis
- Python Training for Data Science
- Python Tools for Data Cleaning


